A Deeper Look at Conversion
Let me tell you the story of my friend Peter1.
Peter is working at a tech company, called findmyho.me as Head of Product. Their product is a real estate search app. The users can search for their new homes to buy. When they find something that they like, they can contact the listing agent using the product. The revenue is coming from the agents. The agent pays them if a potential customer contacts them. And also if the real estate is eventually sold then they get a flat rate of the commission. The product is available both on the web and you can download the app both for iOS and Android.
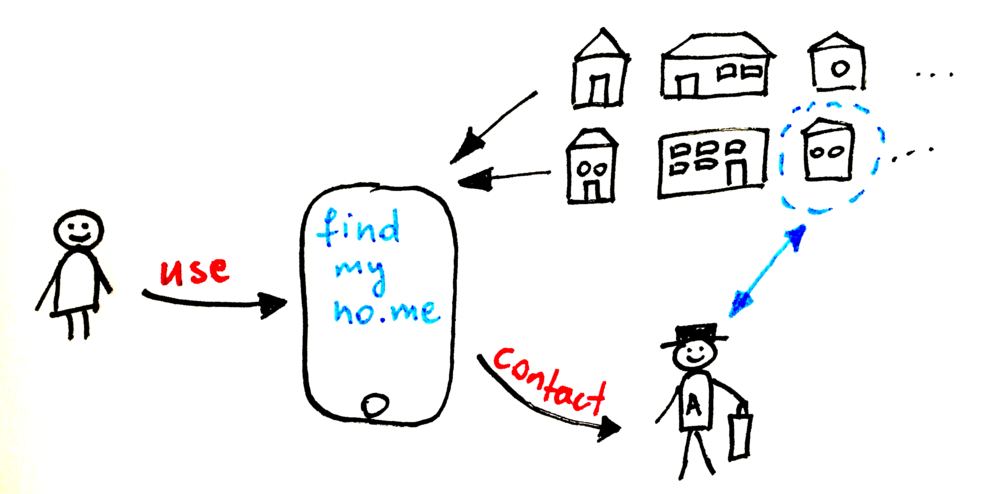
The main KPI of the company is the number of users who contact the agent out of the people who start using the product.
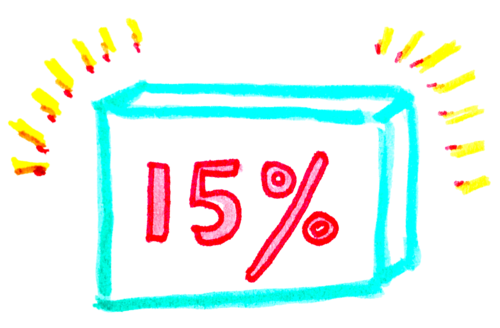
Let’s say that 1000 people started using the product on a certain day. Out of these people 150 people contacted the agent on the same day. So the conversion rate is 15%.
This conversion varies across platforms. On the web it’s 19% and in the app is 11%. Based on this it was clear that people are more likely to contact the agent using the web than the app. It’s a clear decision to invest more into the web if the business wants to make more money.
For Peter this was counterintuitive. Most of the time he talked with the users he heard that they were using the app and not the web to contact the agent. So how is it possible that they converted less?
He looked into the analytics deeper and found the answer on this chart:
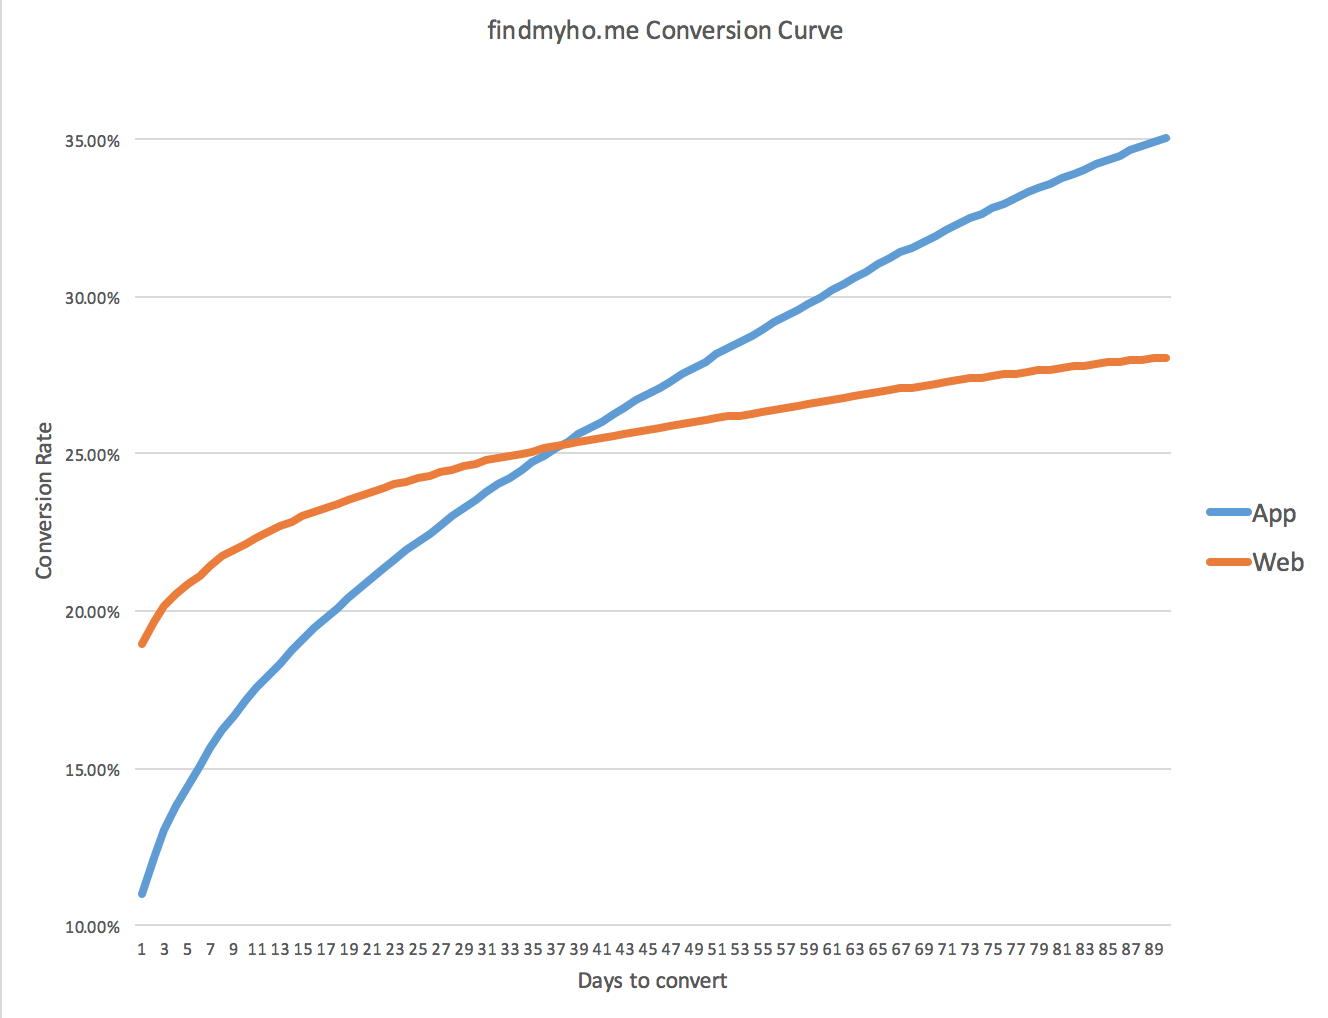
This chart tells us that the app converts worse in the first 38 days, but after that it massively beats the web. In other words: people who start using the product on the web are more likely to convert in the first month. On a longer term though people who started using the app are way more likely to convert.
This was the point when Peter realized that there is a serious issue in the company. An issue that can be deadly to the whole business and stems from one small thing that was overlooked in the beginning.
One Small Thing
Usually when we look at the main funnels of our product we tend to overlook one thing. This tiny thing is one of the most important settings in product analytics.
On top of it, this small thing is the connection between conversion and retention. Understanding this is crucial in the field of product management.
This small thing is the Funnel Window Size.
In this post I’m going to write about the Funnel Window Size and a related topic: conversion characteristics. It’s a deeper look at conversion.
Funnel Windows
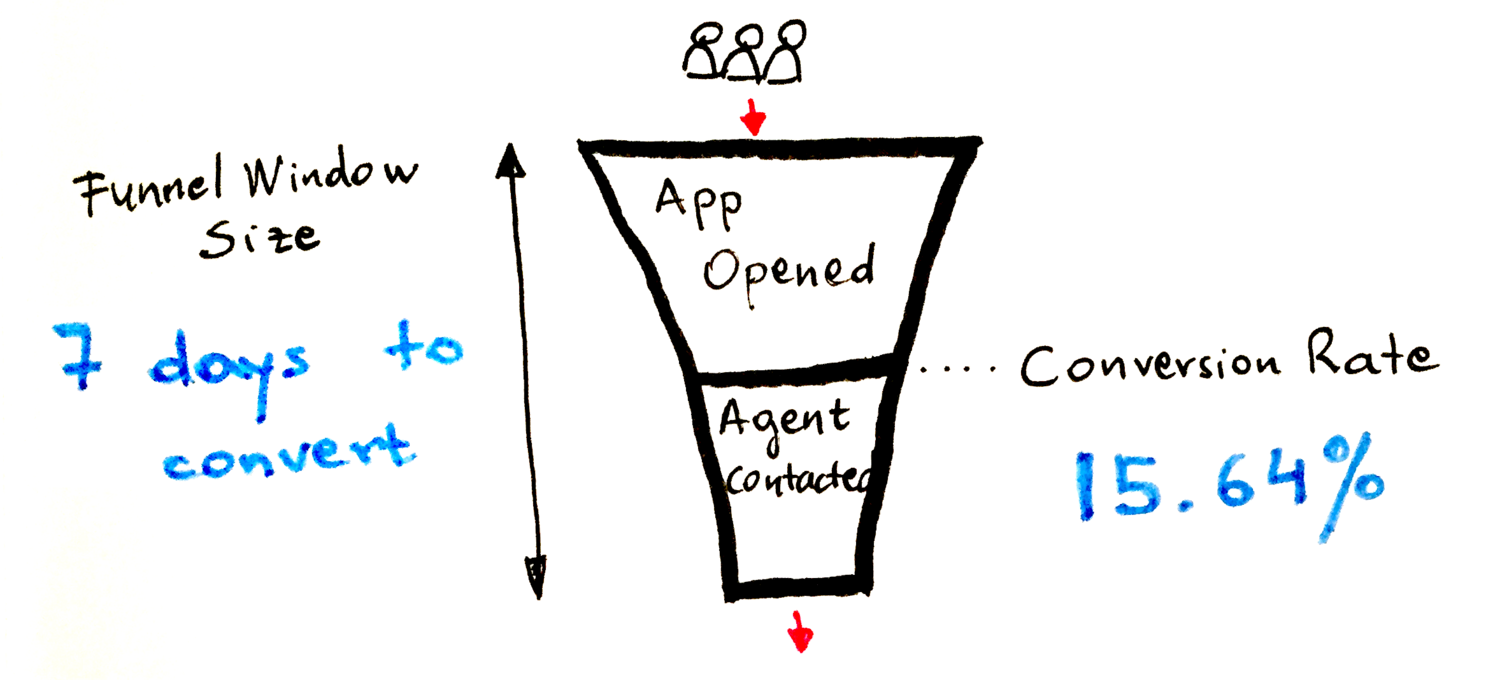
Let’s look at the basic funnel that describes findmyho.me app:
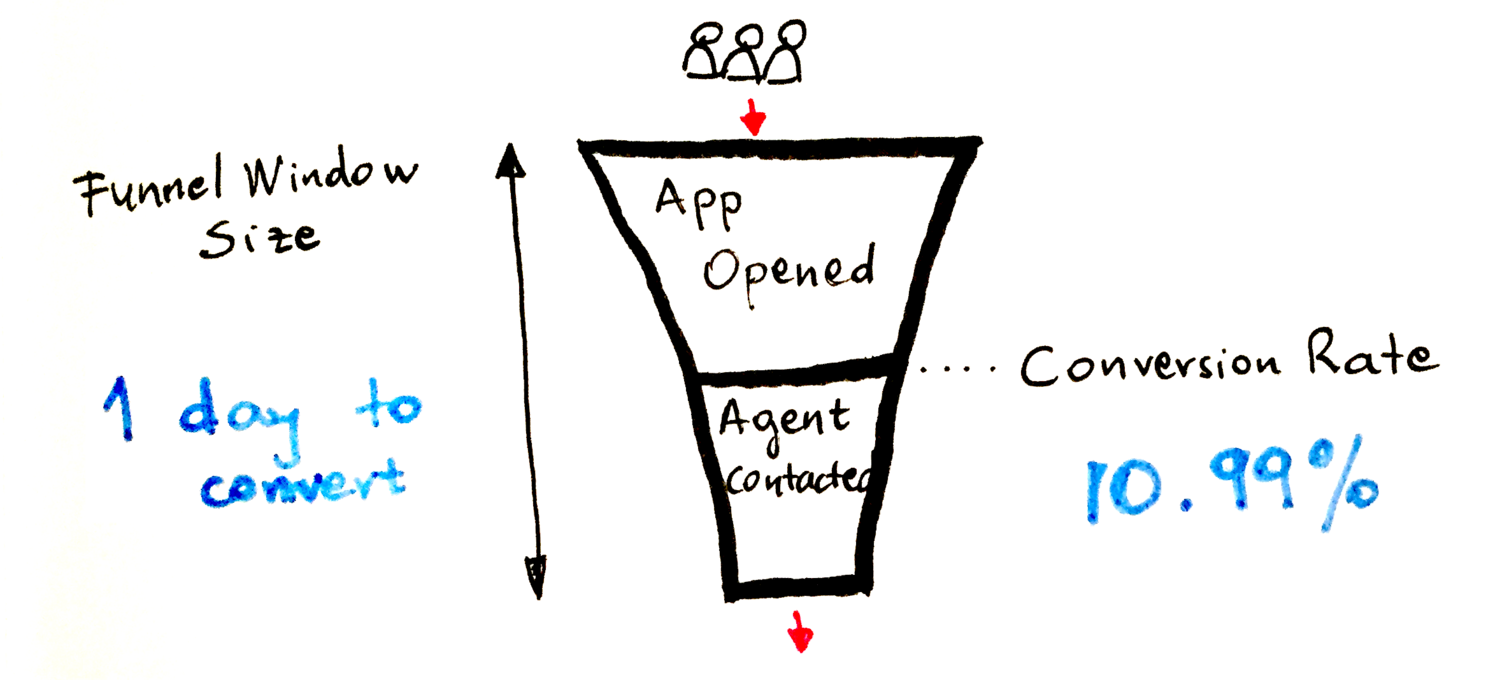
In this funnel we give 1 day to the users to convert (to contact the agent). We measure the conversion rate based on this. Approx. 11% in the app. But what if we would give more time to the users to convert. 7 days for example:
Or maybe 30 days:
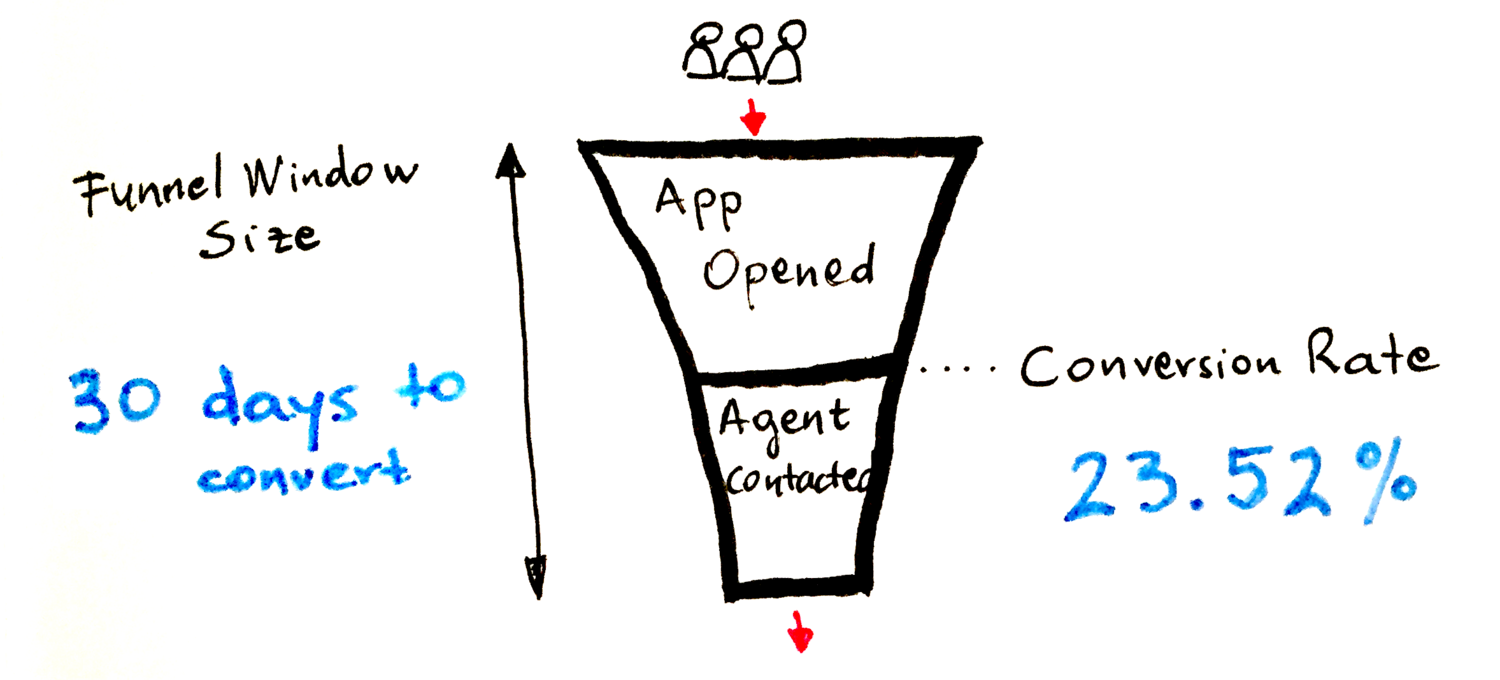
The conversion rate is increasing if we increase the funnel window size. Well, you could say, this wasn’t that surprising. It’s a monotonically increasing number, since users cannot “unconvert” as time goes by.
So then why is this so important?
Let’s think about it. What do we expect from people who are planning to buy a new home? To find a home in 1 day or to spend some time with research and discuss this with their family. Clearly the second one is more realistic based on my observations and experience. It takes time to make a decision to spend serious amount of money on a new home. Definitely not a one day “project”.
This means that a funnel with a one day funnel window is not representing the people’s behavior.
We looked at the conversion rate for 7 and 30 days windows above. Let’s look at it for a lot more different days. Let’s look at how the conversion changes over time.
Conversion Characteristics
The following curve shows the conversion by different funnel window sizes for the same cohort of users in the app:
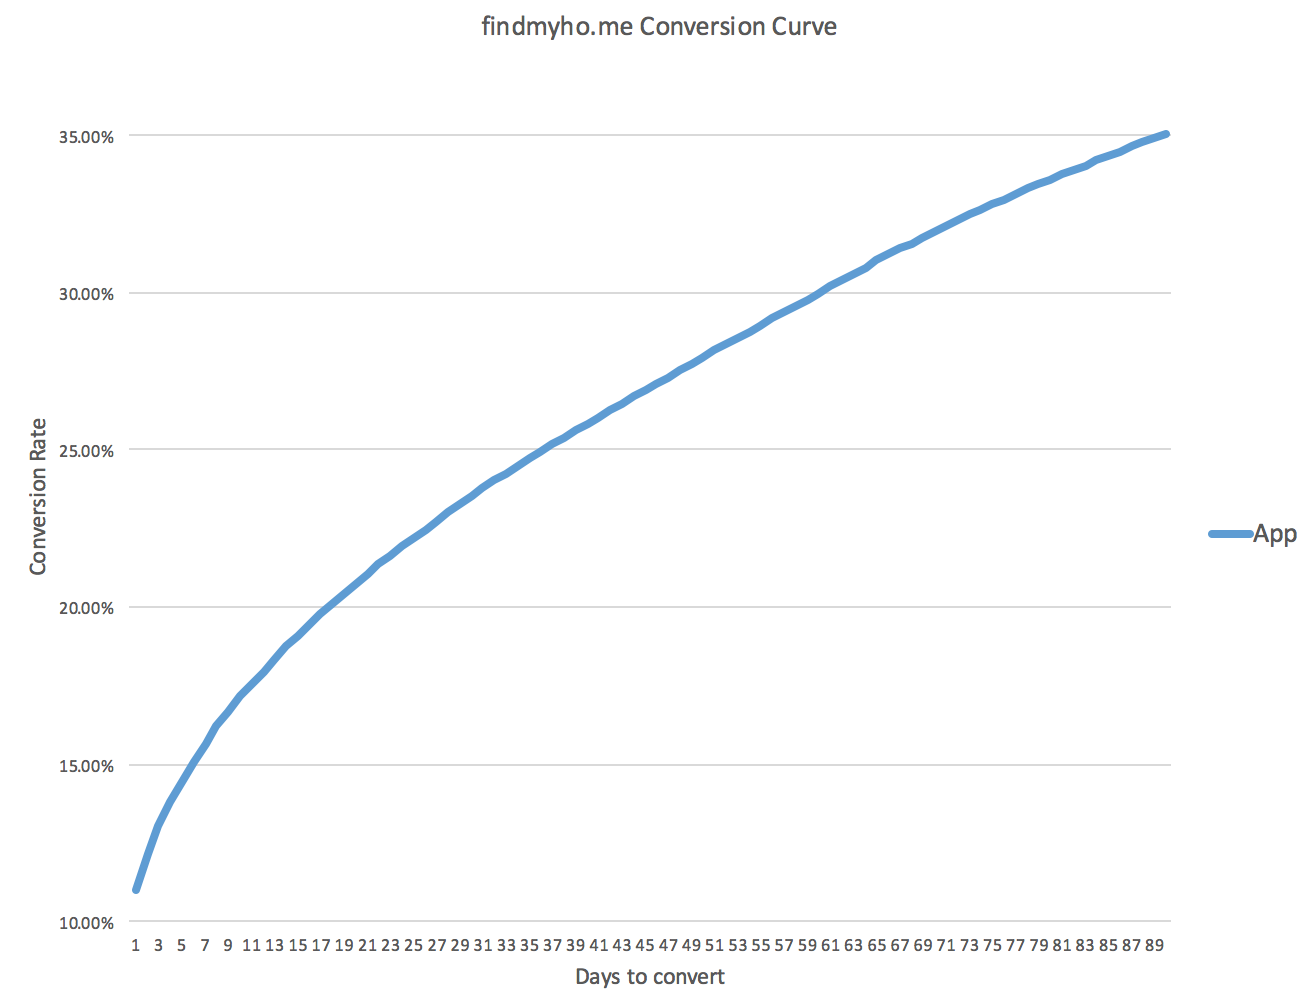
This is the kind of curve that Peter looked at in the beginning.
Since we can segment the users many ways, conversion curves can be analysed by various segments.
For example besides comparing platform performances we could also segment by user acqusition sources:
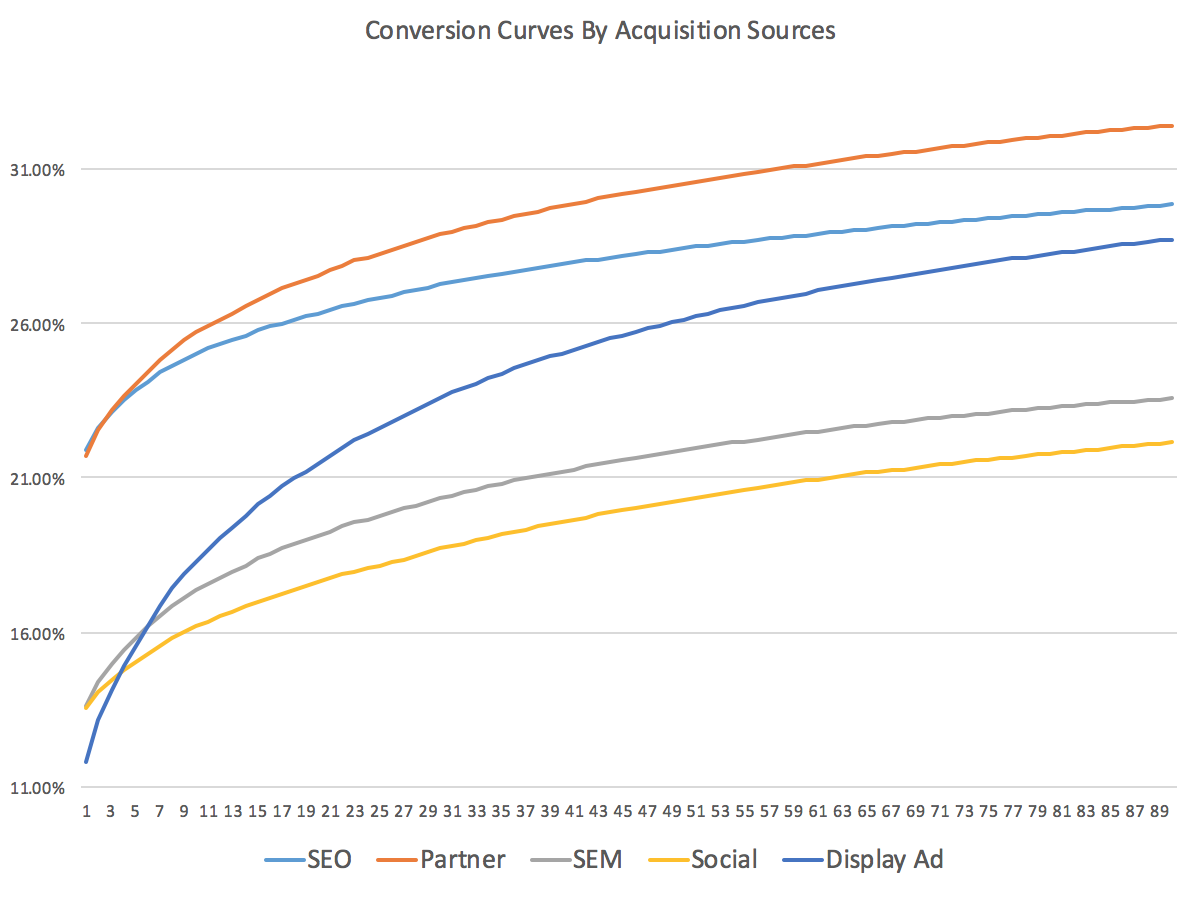
We can clearly see the surprising fact. Display Advertising seems to be the worst in the beginning but eventually it beats both SEM and Social. There is also an interesting learning that people who are coming from the partners of findmyho.me seem to convert worse than the people who are coming from Google and other search engines. But on the long term people coming from partners convert better.
We can also compare the various markets
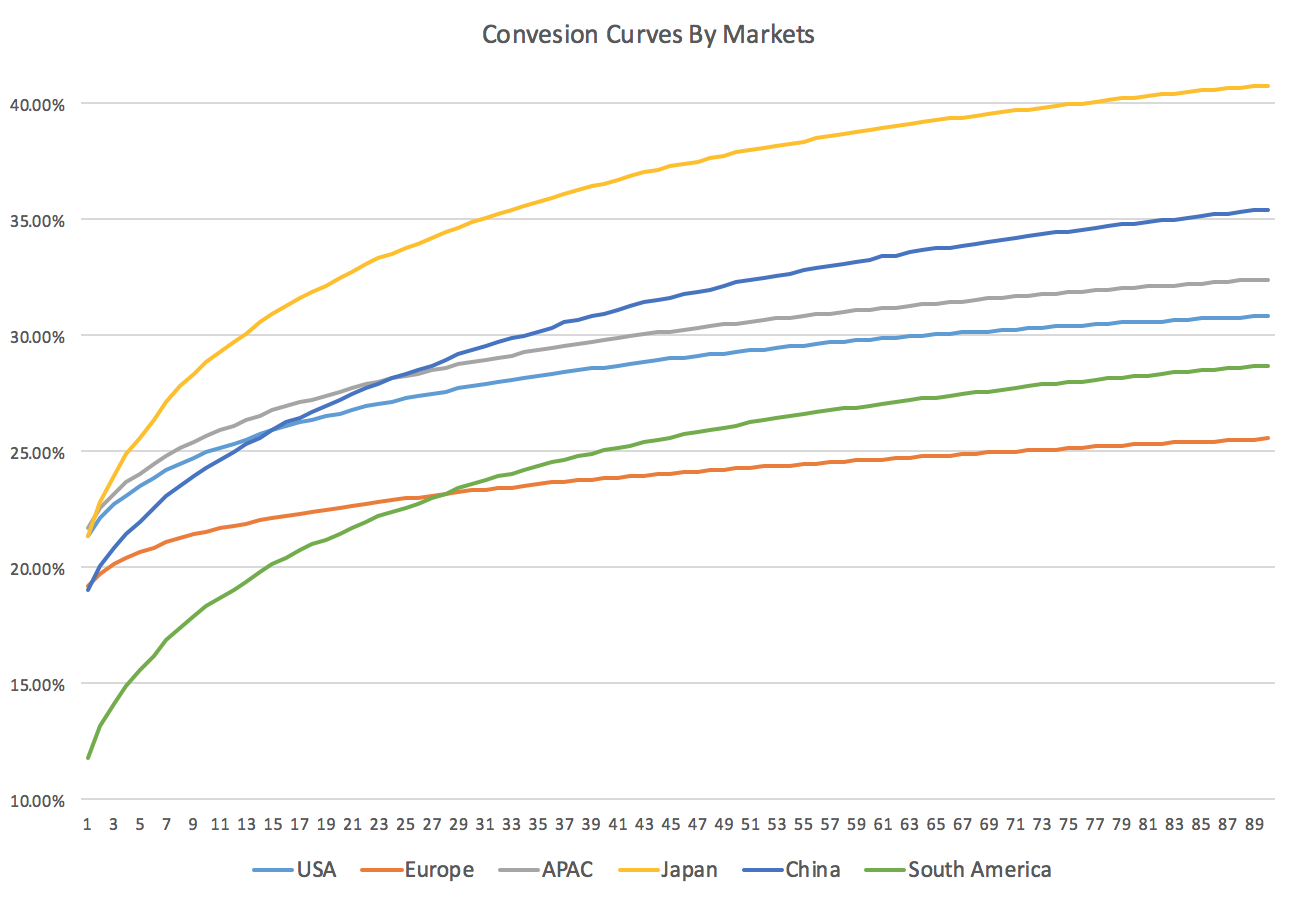
We can find important learnings here too. These can be attributed either to cultural behavioural differences or market strategy differences. In both cases it gives us more insight about where to change things. For example in South America in the beginning the conversion is very low, but then it increases rapidly. If the market strategy of findmyho.me is the same across all markets then it could mean that people in South America take more time to research and discuss the actual purchasing decisions with their families compared to Europe.
As you can see we can extract tons more learnings from the conversion curves compared to a single number. These curves describe the behaviour of our users and the performance of our business too.
This was the thing that Peter realised.
Picking a wrong a funnel window can be deadly to the business. Why?
Wrong KPI
Because it’s easy to say that the most important KPI is the conversion. And it will stick. Everyone will blindly talk about how to increase the conversion rate from 15% to 16%, or with X%, etc.
But if the conversion funnel has an inappropriate window size then it’s not representing the people whom we are building the product.
This means that we picked the wrong number. And it has a terrible amplifying effect. People start optimising for this KPI. For example in case of findmyho.me they want more people to convert in one day. This results in meaningless product changes aiming for only increasing the conversion rate but not creating real value for people. And if we don’t create value for people then they will leave us.
Let’s illustrate it with a simplified example. To increase the 1 day conversion rate, you could introduce a feature that notifies the agent automatically to call any new user if they looked at a listed house in the product. This would result in almost a 100% one day conversion rate. On the other hand people would get so annoyed that they would immediately leave the product. Eventually the number of users would decrease (conversion would still stay at a 100% level), the product would die and so the business.
To put it bluntly findmyho.me employees would confuse the KPI with the Goal. I have seen this many times.
The goal in case of findmyho.me is to help people find their new homes they are looking for. We know from behavioural studies that the more expensive a thing is the more time it will take to make a purchasing decision. A new home falls under this category.
Don’t get me wrong. It’s important to improve the conversion rate. But it really matters what conversion rate exactly. In case of findmyho.me the right goal could be that every single person who started looking for a home contacted an agent in 30 days. This means a 100% conversion rate with a 30 days funnel window size. This is amazingly ambitious I know. To solve this we need to think about the whole user journey and not just optimise for a short term conversion rate. In this case we need to think about cross-platform usage and not just about one platform. If we think like this we will truly create a valuable product for the people who are searching for a new home.
If we don’t do this we are very likely to transform the product into a faceless transactional service.
So what to do?
- Define your goal first
- Revisit your funnels and check if the window sizes are reflecting the goal. If not change them.
- Look at the conversion curves for the funnels
- Build a strategy how to change these curves exactly (where to lift them)
- Whenever you design and develop a feature consider all the above when picking the success metrics
Talking about the user journey and value…
Good luck fellas!
Laz
-
I excluded all data from this post that can be attributed to any companies I worked or I’m working for at the moment. Names, characters, numbers, charts, findings, insights and incidents either are products of my imagination or are used fictitiously. Any resemblance to actual data or persons, living or dead, is entirely coincidental. Findmyho.me does not exist, I am not an expert of the housing market and I don’t recommend you to start a business based on the data or insights presented in this post. ↩︎